Author Archives: Joseph

About Joseph

An atmospheric scientist with a passion for Christ, music and the outdoors.

Turbulence in the Boundary Layer and Effects on Aviation Operations

When it comes to meteorology, not many people understand the complex diurnal evolution of the Boundary Layer (BL). Every day, the sun transforms the characteristics of the boundary layer into a well-mixed convective mass conserving machine. This process, along with others which I will address throughout this paper, make the study of the boundary layer very important. The study of the boundary layer is also important because we spend nearly all of our lives living in it. Forecasts for temperature, dew point, surface winds are all really BL forecasts. We also look at the BL in studying the production or dissipation of turbulent motion through a variety of terms that will be discussed. The study of turbulence presents many issues. How do we model turbulence? How do we differentiate turbulence from other large scale dynamical phenomena? How do we forecast turbulence in the real atmosphere? These are all questions that need to be considered. This turbulent motion or the deviations of the instantaneous mean wind flow (Panofsky, 1959) also causes many issues for aviation operations at airports and the surrounding terminal aerodrome where planes are coming up and down through the boundary layer. Everyday worldwide. According to the FAA’s website, 24 people were injured in 2013 due to turbulence experienced while in flight. In the last 10 years, 369 people have been injured in flight due to turbulence. Notice that no one has died due to turbulence! The encounter of turbulence can come with nearly zero forewarning which is how most of these injuries occur and is also why this is still such an active area of interest. It also however is extremely common, should it be that big of a deal?

In this post, I plan to review the production and dissipation of turbulence in the boundary layer with a focus on its potential effects on the aviation industry. I plan to explain what is objective in a subjective manner as to appeal to a larger, more lay audience. I will start with an introduction to the exciting subject of Boundary Layer Meteorology. From there I will discuss the characteristics of turbulence in the boundary layer as well as its production and dissipation. In the last section, I will discuss the implications of this turbulence on aviation operations in the boundary layer.

Hello Boundary Layer

In studying Boundary Layer during one of the busiest semesters of my college career, it has been a difficult subject to grasp. Take everything you learn in dynamics regarding the governing equations of the atmosphere and apply it to a much smaller time and grid scale. While you are at it, it is for all practical purposes mathematically impossible to model turbulence by following parcels like we do in Synoptic Meteorology. Therefore we apply statistics and utilize ensemble means to reduce the variance in understanding how turbulence progresses through the BL. Don’t let this scare you though! The idea of understanding turbulence and Boundary Layer processes is something that we still have yet to accomplish in classical physics. I plan to explain these things in a simple manner.

Before I go too deep however, let me make some brief introductions to the subject. Boundary Layer Meteorology is the study of how Earth’s surface effects the bottom 3km of the atmosphere over a short time period of roughly an hour or less. There are many meteorological processes which occur in the BL. Most notably including the fair weather cumulus clouds and stratocumulus clouds which includes fog. Ultimately however, the entire troposphere is influenced by changes in the characteristics of Earth’s surface (Stull, 1988). Thunderstorm formation, although not a BL process by itself, is heavily influenced by the BL through surface convection, cold pool interactions, outflow boundaries and various other processes which occur in the BL (Stull, 1988). How do conditions in the BL change? This is a broad question that someone just learning the subject might ask. It certainly isn’t an easy question to answer. Simply put though, change occurs in the BL due to the wind and changes in incident solar radiation. Now wind can be broken up into three categories: mean wind, turbulence and waves (Stull, 1988). I assume you understand what the mean wind is, it is self-defined. What I want to focus on is the occurrence of turbulence and how it is one of the most important transport processes in the BL. As defined above in my introduction, turbulence is the deviations of the instantaneous mean wind flow or the gustiness imposed on the mean wind flow (Stull, 1988). Differences in solar heating lead to the production or dissipation of turbulence and also lead to the different types of layers seen within the BL which do include but are not limited to the mixed layer, the residual layer, the stable boundary layer, the surface layer and a few others that I won’t mention for purposes of keeping this post short (Figure 1). These different layers are products of different thermal and flow properties. The mixed layer occurs in the afternoon when radiational convergence at the surface causes convection and therefore the vertical expansion of the BL as air warms, expands and then rises. The residual layer forms at sunset when surface heating is lost, turbulence begins to dissipate at the surface instead of being produced. However, the layer maintains characteristics similar to that of the mixed layer, but is now just separated from the surface. It is this layer that can instigate early morning thunderstorms. Moving into night time is when the stable BL forms as the tendency of air in contact with the surface will be to cool and become stable. The surface layer refers to the layer nearest to the surface. So this is anywhere from centimeters above the surface to a few meters. Some scientists define it as the bottom 10% of the BL. Turbulence is contained in all of these layers and in the next section I will go into more depth as to what the characteristics of turbulence are.

Figure 1 - The many different layers produced in the BL.

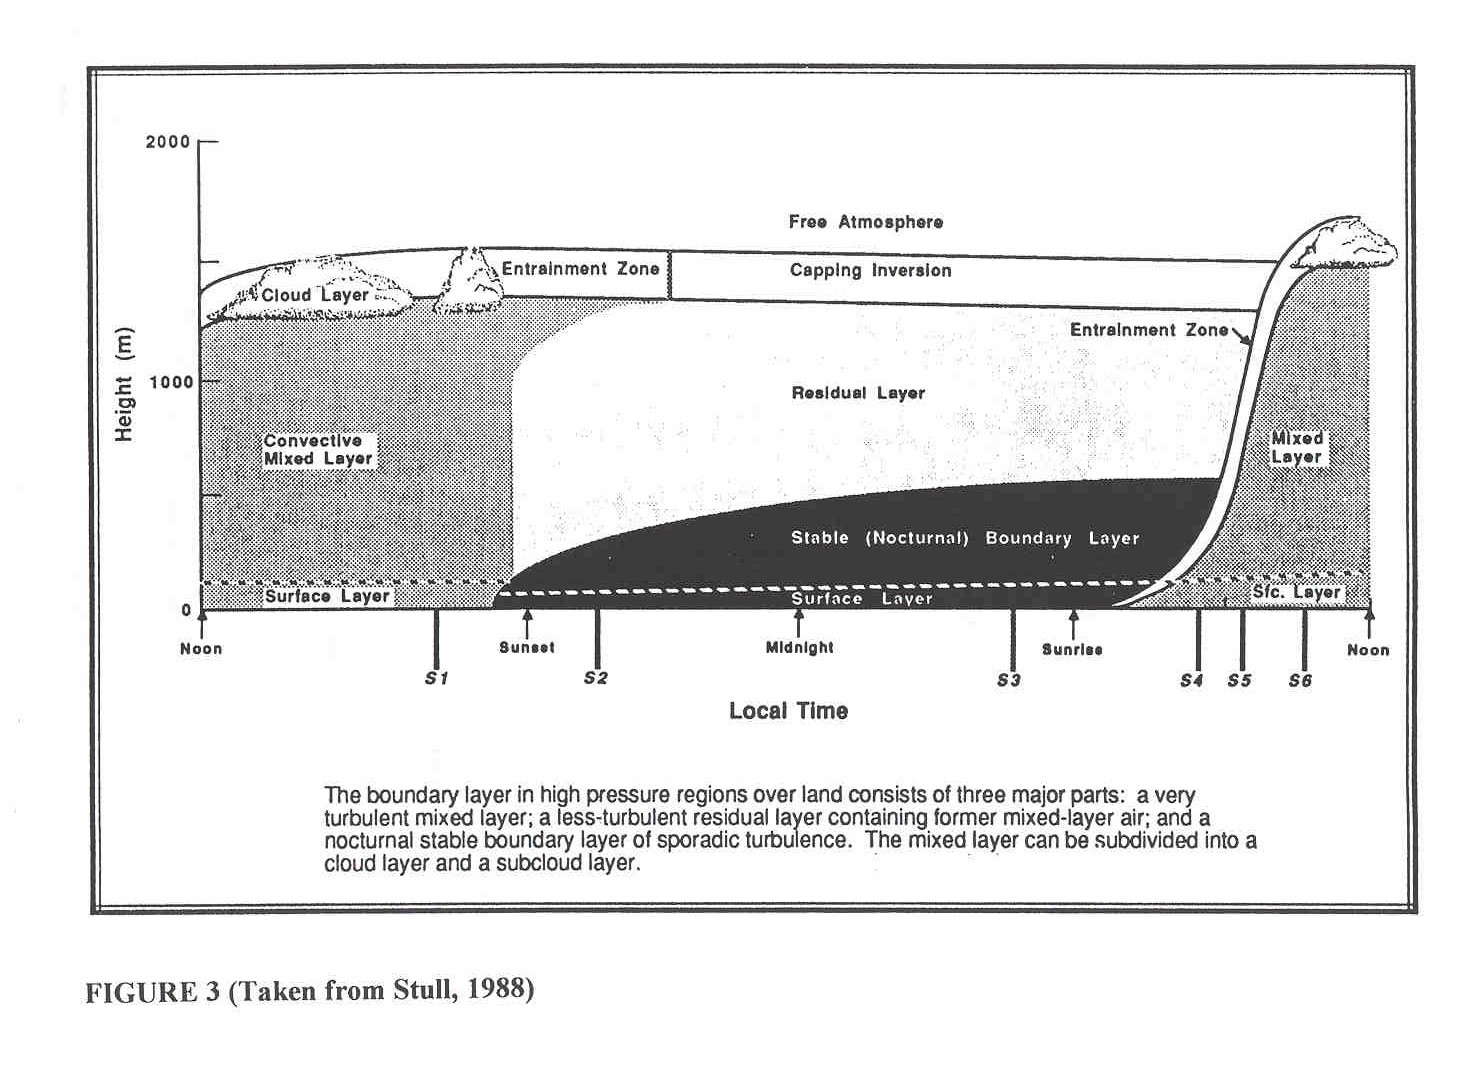
Figure 1 – The many different layers produced in the BL.

Turbulence

In doing some research for this paper, I have read a few cases of injuries experienced on planes where turbulence was the cause of injury. The one that flew out to me the most was a case of a flight from Rio de Janeiro to Houston which was forced to make an emergency landing in Miami due to 4 seriously injured passengers in August of 2011. 26 people were injured on this flight due to turbulence. That was not what stood out to me about this article though. What stood out to me was how the article highlighted that different meteorologists were saying different things regarding the presence of turbulence during the flight. Directly from the article, “Meteorologists differed on weather conditions at the time the Houston-bound plane encountered the turbulence just northwest of Puerto Rico.” I got the feeling from this article that people don’t recognize the physical complexity of turbulence and trying to predict its occurrence. Meteorologists are justified in saying this because turbulence is a very difficult phenomena to predict. You might as well be flipping a coin to see if it will occur in a particular area. Therefore, in this section, I will highlight turbulence and its characteristics in the BL to try to raise awareness as to the challenges that come with studying turbulence. Obviously, this will be focusing on the turbulence seen in the BL, but can also be applied to that seen in the free atmosphere.

Turbulence in the BL is different than turbulence aloft (free atmosphere) in the way that it is generated. Turbulence seen in the BL is primarily generated by forcings from the ground. Turbulence above the boundary layer is either generated in convective clouds or in the presence of jet streams where wind shear can create clear air turbulence. In the BL, production of turbulence comes from solar heating or thermals, frictional drag which causes wind shears (similar to CAT) and obstacles which then cause turbulent waves in the wake of flow downstream of obstacles. These different production methods lead to countless different sized circulations or eddies. In the mixed layer, eddies are generally elongated. It is this stretching in the mixed layer that actually is a source of instability for tornadic thunderstorms via vertical vorticity. In the SBL, eddies are generally more horizontally orientated. Hopefully this sounds strait forward. The BL is very much dictated by the influx of solar radiation. When that influx is lost, the elongation of the layer stops and subsidence occurs from above. Furthermore, turbulence is nearly continuous in the BL and more sporadic in the free atmosphere. This is due to the large amounts of turbulent production and dissipation seen throughout the day in the BL.

What is the challenge then? I’ve been talking up the complexity of turbulence this entire paper, why is that so? It comes down to the fact that turbulence is extremely difficult to describe and forecast mathematically. Turbulence generally occurs in circulations called eddies which I mentioned above. They are produced particularly in the mixed layer in the afternoon hours. It is these eddies that are transporting heat, moisture and momentum in the BL. Boundary Layer Meteorologists have developed stochastic methods to explore these turbulent eddies. That is, methods that deal with the averaging of the change of eddies over time since it is next to impossible to mathematically follow the them. To get average conditions means we need to measure something first, so how the heck do we sample turbulence? It is extremely difficult to sample these eddies by simply looking at a large area of space in time. For sampling turbulence and eddies, it is much easier to look at a specific point for a long period of time. This way, we don’t have to look at such a huge area where it is likely that conditions vary extremely from one side of the domain to the other. We don’t have the sensing capability or the funding to be able to put up enough sensors to do this. With this said, we then move to one of the most important topics covered in BL meteorology which is Taylor’s Hypothesis. This states that we treat turbulence to be frozen as it moves over our sensing device at a specific point for a large period of time. That is that it does not change shape or characteristics as it is passes over the sensor. This allows us to sample the turbulent eddies more effectively, but one must note that real turbulence is not frozen! Turbulent eddies are constantly evolving as they move over different types of land with varying meteorological conditions. Taylor’s Hypothesis allows us to think of eddies spatially based off of temporal measurements. So as you can maybe see here, the understanding Taylor’s hypothesis is a key concept to understand in BL meteorology.

Another challenge is the spectral gap. The spectral gap is a lack of variance in turbulence at the intermediate time or space scales (Stull, 1988). What this physically means is that at time scales around one hour, the spectral intensity is significantly less than that seen on large scales. This gap allows us to differentiate the difference between large scale (synoptic) phenomena like frontal passages and small scale phenomena like turbulence. Why is this an issue? This sounds fantastic! Well forecast models are calculated at time scales of about 1 to 3 hours depending on the model. This means they are calculating at a scale in the spectral gap. Scales larger than the time scale (synoptic scales) are resolved well but scales smaller than the model cannot be modeled and are approximated by parameterizations. This presents numerous errors in models which only grow with time.

Aviation Application

When people step on a flight, there is no better remainder of the difficulties in flight operation than the experiencing of turbulence. Whether that is just after liftoff or at 35,000 feet. Keeping our focus on the Boundary Layer, all of what I have stated regarding turbulence in the BL has a very important application to flight operations in the BL. Have you ever wondered why when you are climbing after takeoff or descending to landing the ride seems a little bumpier? This is turbulent eddies at work! Many passengers get made uneasy when this happens, but truth is, it’s completely normal (excluding the rare cases).

What are you experiencing though when you feel that sudden jolt? To adequately answer this question, we need to first answer how a plane is held in the air in the first place. Simply put, differences in pressure on either side of airplane wings are the source of lift on aircraft. Air moves faster over the top of the wing than the bottom which in turn causes lower pressure to occur on the top of the wing. This idea is also known as Bernoulli’s Principle. So if air is moving constantly over the wing, you would expect the aircraft to be flying steadily at a constant altitude. Turbulence though, as defined earlier, causes rapid increases in the mean wind to flow to move over the wings. This creates a rapid change in pressure which in turn causes the aircraft to react rapidly to equilibrate the pressure on either side of the wing. The result that you feel on the inside of the plane is that which causes your coffee to spill on your lap.

Planes are built to handle a respectable amount of turbulence. So pilots will generally think of turbulence more in terms of conveniency rather than a serious safety issue. Especially in the BL where passengers are generally instructed to remain seated until the aircraft reaches cruising altitude. What pilots and airport managers need to watch out for are wind gusts which could make landing exceptional difficult on rare cases. Windy days boast the mechanical production of turbulence at the surface so the BL on windy days is a turbulent mess. Especially near the surface where wind is trying to go around buildings and trees. Otherwise, on just a hot summer afternoon, you can expect a bumpy landing.

Conclusion

The study of Boundary Layer Meteorology is a field which needs a lot of work. Our knowledge and understanding of turbulence in the classical sense is very limited. This is mainly due to the complexity and nature of turbulence itself. We do not have an efficient way to measure turbulent eddies without making large assumptions. Once we have this data, we may try to forecast its progression through time based on stochastic models. This method works but is not as accurate in the long run as error is introduced through averaging and parameterizations in governing equations. The aviation industry and the people that utilize its services need to recognize the complexity of turbulence which every flight worldwide will run into at some point on its journey. Only on rare circumstances will you have turbulence severe enough to cause injury to passengers like that seen in the flight from Rio de Janeiro that made an emergency landing in Miami. This was caused by clear air turbulence too, not turbulence found in the BL. It is even rarer to find turbulence doing structural damage to aircraft since this is generally associated with thunderstorms and are easily spotted and avoidable. Raising awareness of these unknowns will help increase research on this topic. So fly informed!

Works Cited

Panofsky, Hans A. Atmospheric turbulence. No. SCR-118. Sandia Corp., Albuquerque, N. Mex., 1959.

Stull, Roland B. An introduction to boundary layer meteorology. Vol. 13. Springer Science & Business Media, 1988.

Catalano, Franco, and Chin-Hoh Moeng. “Large-eddy simulation of the daytime boundary layer in an idealized valley using the Weather Research and Forecasting numerical model.” Boundary-layer meteorology 137.1 (2010): 49-75.

Smith, Patrick. Turbulence: Everything You Need to Know. Patrick Smith’s Ask the Pilot: All Things Air Travel. < http://www.askthepilot.com/questionanswers/turbulence/>

Purdue classes…

Space Weather – The Meteorological Frontier

Talk about a subject that tilts heads, space weather is a rapidly growing field in science. I was first exposed to the subject in my Intro to Atmospheric Science class my freshman year at Purdue University. The professor, Dr. Ernest Agee pulled up two websites at the start of every class. The first being spaceweather.com and the other being the NCAR Real-Time Weather site. I had no clue why we were looking at space weather in that class. Weather in space? How does that work out!? Heliophysics… Sounds like a made up sci-fi term. These were thoughts that were running through my head. Little did I know how awesome the subject was! Four years later and I still look at the same space weather website nearly daily. The subject is intriguing, complex, dynamic, and is now becoming more and more economically important. Many people are turning to meteorologists for information about this subject and therefore many meteorologists are being recruited into this field which has been particularly significant for me as I start to consider career options. In this post, I plan to address a question that is commonly asked at me. What is space weather and why is it a growing field in science right now?

As defined by the Space Weather Prediction Center, space weather describes the variations in the space environment between the Sun and Earth. The study of space weather explains the multiple phenomena that can bring harm to satellite and Earth based infrastructure. Heliophysics is the branch of science that describes space weather (to make this post simple, this will be the only time I bring up the term heliophysics). It is no surprise that as we rely more and more on technology, we are relying more and more on satellite based communication and a dependable supply of electricity. GPS services, satellite based communication, astronauts and polar flight routes are just a few examples of services that can be interrupted by space weather.

Okay, so space weather refers to the phenomena that occurs between the Sun’s surface and the Earth. How does space weather work though? What are the phenomena? First off, I would like to comment on the consistency of the Sun’s energy output. This may seem elementary, but its important. The Earth is ALWAYS being bombarded with various wavelengths of radiation from the Sun. These include ultraviolet, visible and infrared radiation. Earth’s atmosphere manages to absorb and reflect much of the harmful UV radiation and much of what we experience on Earth’s surface is of visible wavelengths with a minimal amount of infrared radiation. Note figure 1 one showing the distribution of radiation we see on the surface of Earth. The Sun doesn’t go to bed at night and it doesn’t take naps in the middle of day behind cloud cover. Its ALWAYS present and thank goodness that it is! It is this radiation from the Sun that allows the existence of life on Earth.

Figure 1 // Spectrum for Solar Radiation on Earth. Note that visible wavelengths has the highest irradiance (or flux of energy per unit area).

Figure 1 // Spectrum for Solar Radiation on Earth. Note that visible wavelengths have the highest irradiance (or flux of energy per unit area).

Going off this idea that the Sun is ALWAYS spewing energy in all directions. The Sun’s outer atmosphere also releases energy in the solar wind, large amounts of radiation in solar flares and magnetic fields and plasma with coronal mass ejections (CME’s).  All 3 of these processes are the main phenomena that make up space weather.

The solar wind is a continuous out flowing of electrons and protons in the form of plasma from the Sun’s surface. There are also embedded magnetic fields with this plasma which will be very important when looking at how the solar wind will interact when it collides with Earth’s magnetic field. The solar wind varies in speed and density based on surface conditions of the Sun (look into coronal holes). The solar wind alone has the power to spark auroras and geomagnetic storms if its speed, density and magnetic field direction are working together.

Figure // Shown above is the latest forecast of conditions in the solar wind, as predicted by the WSA-Enlil model from the SWPC.

Figure 2 // Shown above is the latest forecast of conditions in the solar wind, as predicted by the WSA-Enlil model from the SWPC website. I include this because it allows one to visualize how the solar wind travels from the Sun outward into space.

A solar flare is another process that powers space weather. A solar flare is a large release of radiation from the surface of the Sun and are commonly associated with CME’s which will be covered in the next section. A solar flare releases extreme amounts UV radiation and X-rays thanks to a re-connection of magnetic field lines on the Sun. Its this process that causes radio blackouts on Earth. Though it may seem like radio usage is decreasing, it is still a widely used technology by the military, air traffic controllers and various emergency response organizations.

Figure 2 // An X-class solar flare on July 6th, 2012.

Figure 3 // An X-class solar flare on July 6th, 2012.

Last, but certainly not least is the Coronal Mass Ejection (CME). The Sun produces an UNBELIEVABLE magnetic field from the amount of energy that is being produced from its core. On the surface (the corona), these magnetic field lines tend to get tangled and twisted with huge amounts of energy being transported by extreme convection. When this happens, potential energy builds until this large gradient is released in the form of a CME. Nature always wants to be in equilibrium, even on the Sun. With this said, CME’s contain magnetic fields and plasma and spark enhanced geomagnetic storms and auroras on Earth. Below, you will find a video showing a CME eruption on March 14th of this year.

Figure 2 // An image from SWPC that summarizes the locations of space weather processes.

Figure 4 // An image from SWPC that summarizes the locations of space weather processes. This image is a dramatization and is not to scale.


Since the Sun is constantly releasing these flares, ejections, wind and what not, why don’t we see more geomagnetic storms and auroras? Much like how the ozone layer protects us from harmful UV radiation, Earth’s magnetic field protects us from the solar wind and CME’s. Earth’s magnetic field can be simply visualized like that of a magnet. Its shape changes like that seen in Figure 4 thanks to the pressure of the solar wind. The solar wind causes a compression on the day side of Earth and stretching on the night side. Its Earth’s magnetic fields that explain why the auroras and geomagnetic storms occur most frequently at the poles! Energy released in CME’s and contained in the solar wind travel along the magnetic field lines of Earth which are directed to the poles. It is here that this energy excites oxygen and nitrogen molecules in the ionosphere. When these molecules return to their steady state, they release energy in the form of light! This creates the aurora. A geomagnetic storm is a large disturbance in the magnetic field of Earth. It is CME’s that most often cause this large disturbance. These storms cause heating in the ionosphere which can cause errors in GPS positioning information, extra drag on satellites in low orbit and geomagnetic induced currents in the power grid and pipelines. Not only this, but storms can also expose people and flights in polar regions to unhealthy amounts of radiation. If given a warning in advance, companies can take precautions to save millions and even billions of dollars in damage.

The Sun is a fusion masterpiece. We have seen all of these processes described above for thousands of years. Its only been in the last two centuries that people have begun to study and understand what is going on. Today, greater than ever, we look to understand the variations in the Earth-Sun space environment to protect life and property. It is why this field is growing so quickly. Forecasters at the Space Weather Prediction Center take analysis data from satellites and models to predict if and when a particular storm will impact Earth. If they issue a warning, this allows companies to take the necessary precautions to protect the power grid, drilling and satellite operations, and astronauts in space. They just released a new website thanks to the increasing demand from companies and even the general public. The more we rely on satellites, the more we explore into space, the more we will need to understand and predict space weather.

Science rules!

Joe Bauer


For more information on space weather, explore the SWPC website and this website.

Further reading // where I got my knowledge:

Howard, T. A., Webb, D. F., Tappin, S. J., Mizuno, D. R., & Johnston, J. C. (2006). Tracking halo coronal mass ejections from 0–1 AU and space weather forecasting using the Solar Mass Ejection Imager (SMEI). Journal of Geophysical Research: Space Physics (1978–2012)111(A4).

Liu, Y., Thernisien, A., Luhmann, J. G., Vourlidas, A., Davies, J. A., Lin, R. P., & Bale, S. D. (2010). Reconstructing coronal mass ejections with coordinated imaging and in situ observations: Global structure, kinematics, and implications for space weather forecasting. The Astrophysical Journal722(2), 1762.

Lanzerotti, L. J. (2001). Space weather effects on technologies. Space Weather, 11-22.

Schwenn, R. (2006). Space weather: The solar perspective. Living Reviews in Solar Physics, 3(2), 1-72.


A Southwest Adventure

Another two weeks of summer have flown by. Thankfully the last two weeks of my summer have been arguably the most fun two weeks of any summer I have ever had. Some people enjoy water parks for vacations, others enjoy amusement parks, but how about the United States National Parks? My group and I managed to hit 5 of them. Figuratively of course. Clint Lacure, a good friend of mine who will be deploying in the Army soon, and myself had been talking throughout the spring 2014 semester at Purdue about doing a road trip out west to hike the Grand Canyon. We eventually decided to officially start pursuing the idea toward the end of the semester when we added Andy Hesselbrock to our line up. We had no idea how much planning a trip like this could take! To get backcountry permits in some of these National Parks, you need to reserve them up to 6 months ahead of time! Many of the hikes we did were some of the most popular in the world. We being college now-planners started planning only about 5 weeks ahead of our departure date of Friday, June 20th, so needless to say, we were a bit behind on our planning. I was however amazed in retrospect how quickly and efficiently we were able to put this trip together. Our trip began on Friday, June 20th, where we departed at 4am EDT for St. Louis, MO to visit the Gateway Arch. Our trip then concluded back in West Lafayette, IN on Sunday, July 6th at around 8am EDT after 17 hours of continuous driving. SO MUCH CORN. Everything in between is found in my journal entries below. Enjoy!

Saturday, June 21st – Grand Canyon National Park

SPC

Me outside the NWC in Norman, OK

Driving straight here was an unbelievable experience! Not to mention stopping at the Storm Prediction Center and Meteor Crater. So much science!! This trip may turn out to be quite educational. Working with SPC chief Roger Edwards was unbelievable. He taught me a lot about the importance of analysis. This guy has been working in SPC for close to 30 years and practically was speaking in another language to me expecting me to understand it all. I tried, sometimes in vain, but this gives me something to strive for! Repetition, repetition, repetition… Seeing the Grand Canyon again is like seeing it for the first time. Your head literally cannot wrap its mind around it. It’s probably not real. Aliens… thats the usual cause of crazy things right? I feel as though I can come here a thousand times and not get bored of seeing it. Pictures can’t capture the depths of its landscapes and neither can yo brains… ITS CRAZY. AND I’M GOING IN IT!!!!!


Its amazing how much of a different world it is out west. From soil contents, to climate, to people. Its a very different region that has a completely different natural beauty that I believe as a native Hoosier can fully appreciate.

Wednesday, June 25th – Powell Lake in Page, Arizona

So going into the Grand Canyon is way better than seeing it from the top. It was hot on levels I didn’t think were possible, but it was unbelievable to experience such a sight from within to put everything into perspective. I took an uncountable number of pictures today that I am sure will not come out as I hoped cause this thing is just SO BIG … well, GRAND! On our way down, we started very early at about 4am. I had 3 liters of water packed for since the there is no water on the South Kaibab Trail and took us about 6 hours since we stopped to enjoy the scenery so much. It was 7 miles in length and 4780 feet of decent. If you really wanted, you could nearly cut that decent time in half with no breaks. The sunrise from Oh Ah Point was one of the best I have ever seen and also makes for great pictures. I highly encourage any future hikes to start before sunrise and then stop at Oh Ah for a snack and water break. Did I mention it was hot? Both hikes on the way down and up were hot! At Bright Angel Campground (where we stayed), it was 109 in the shade and 124 in the sun by midday! The heat was like a wall that just kept you from wanting to do anything at all… So we didn’t. Thankfully, there was a heavenly cool stream right next to our campsite that made the day heat more bearable. A note for the future, SECURE your food in the campground! The fat squirrels will eat anything and everything. Those jerks ate my banana chips and bagels. On the way back up, we woke up at 2am so we could be on the trail by 2:45am. Our thoughts were that if we started early enough, we wouldn’t have to hike in the day heat at all. Bad news about the early start, scorpions were everywhere. I saw 2 before even leaving our campsite. It was a hard hike back up Bright Angel Trail, but we made it out by around 9:30am. Thankfully, there were many water stations along Bright Angel, so we didn’t have to carry as much water as we did on the South Kaibab. It was 9.5 miles in length and 4380 feet of elevation gain. In other words… ALL YO LEGS WILL BE SORE! I consider myself to be very strong aerobically as I am a runner, but I was breathing heavy and my legs were feeling the elevation swag. It would be useful to train at least a little bit before this hike. Funny story on the way up, many of the tourists asked us what we were doing and cheered us on as if we were in a competition. As if we had discovered the place. This was very encouraging and actually helped us handle the hike up. It also was SUPER helpful to say hi to everyone on the trail too.. and I mean EVERYONE! This keeps your moral high and your thoughts off of how tired you are, helping you to further enjoy the experience. Also, a ton of people acknowledged my Purdue shirt, just noting that Purdue is one heck of a big network!

Just after Skeleton Point.

Just after Skeleton Point.

As of currently, I journal from Page, Arizona and am comfortably drunk. The last two nights we have gotten drunk to help us fall asleep in the 80+ degree heat. Sounds immature, but its worked wonders! Sleeping in the desert is hard. I will never take air conditioning for granted again after this trip. Powell Lake, the place we are staying, is such a wonderful place. HOT, but beautiful in its own way. The lake itself is created by the Glen Canyon Dam which we managed to tour for $5 during the day. We saw it as a way to get out of the heat. Back at Lake Powell, Clint and I made our way to a large rock in the middle of the lake this afternoon and it was a lonnnnng way out there (about 100 minutes round trip), but fun! Bugs everywhere, sandstone, freezing cold water in the 100 degree heat but you know. Otherwise met some awesome people that gave us free food on the beach tonight! SO GOOD! … Clint probably ate too many beans. I say nothing more. We definitely would’ve spent more money without them though. Thank God.

Powell Lake… View of giant rock we swam to on the left.

I’ve also learned so much about the stars from Andy. Yay for Andy! I love the stars and have been looking at them for a long time but have never had someone knowledgeable enough to teach me. The night before we started our Grand Canyon hike, we went to the Grand Canyon star party were all these astronomers had brought their telescopes for us to use. We saw Saturn, Mars, clusters and stars that were a long way away. Its pretty much awesome. MORE SCIENCE!! We leave for Zion tomorrow, can’t wait! Good night.

Friday, June 27th – Zion National Park

What a crazy day at Zion National Park. Got in yesterday to grab our permits, apparently you can’t leave the backcountry without buying another permit… This is dumb because it means we need to find a new place to stay tomorrow for when we are done with the narrows, which will be sweet!!

Anyway, today we hiked 12.2 miles and gained 1870 feet of elevation from camp to observation point. Our camp was located where the East Rim Trail and the Trail to Cable Mountain split. Great location and great hike from there to obs point. Long, but some very nice scenery along the way and obs point was unbelievable! Also, starred death in the face multiple times today. First, we saw 2 flibin raddle snakes right on the trail to obs point. We flipped out to say the least. I’ve never heard Clint (an Army man) raise his voice before, so when he did, I made sure to BACK UP! Than I ran out of water within 30 minutes of leaving obs point (it was maybe 2 hours back). By the time we made it back to camp, I was exhausted and quite dehydrated. Very dry mouth, beginning to feel dazed and all this after only an hour and a half. Couldn’t imagine coming here for the first time and having to bring water to survive. Crazy.

Tomorrow we head to the narrows! Will be packing the Go-Pro and hopefully will get some great pictures! Stars out, good night.

Monday, June 30th – On the Road

Wow! Zion NP is definitely my favorite stop so far on our trip. The trails were great, the weather was relatively comfortable, and the scenery was fantastically variable in comparison to the Grand Canyon. The Grand Canyon wins by far in terms of its views and vistas, but Zion had much more to offer. Observation point is the biggest view in the park I would say and Angels Landing is practically a climb with an almost equally cool view as observation point. My favorite hike of this trip so far was the Narrows! Your trail IS the Virgin River and your surroundings are unbelievably breathtaking. The water is very cool but you can stay warm since the air temperature is so spice. We also found a few places where the water was deep enough for us to jump in off of rocks. Some of those jumps might have been a bit sketchy, but it turned out okay. The only down side, this is Zion’s most popular hike so it is very heavily populated, but even so it was still an awesome hike! Andy did not have his phone on him (good thing too!) so we don’t know how far we went in. We estimate that we went about 3-4 in and out, giving us a total of about 6-8 miles.

We then hiked Angel’s Landing after the Narrows. We wanted to make it back before the last bus left at 9:45pm, so we were in a big hurry going up the 2881 foot cliff. As tired as we were from our day at the Narrows, the view of the sunset from Angel’s Landing was well worth the hike!


Tuesday, July 1st – Fruita, Colorado

So here we sit in a little camp ground in Fruita, CO. Our tour of the south west is over and so begins our final leg of our trip. Its hard to believe we start our way back home in 3 days but I’m gonna try hard not to think about it, its been real fun. Today we hiked out of Canyonlands. Roughly hiking 4 miles out and about 5 miles in. Our camp ground was unbelievable! Campsite CP-2 and it was way out in the middle of no where. We saw a beautiful sunset as we ate our dinner. WP_20140630_20_44_02_Pro WP_20140630_20_50_35_ProTruly an experience I won’t forget from this trip. Canyonlands is a weird place. More aliens probably. I say weird as a positive adjective because the place made it seem like we were on a martian planet. All of the trails were over rock, so they were marked by rock piles which made navigating a tad more interesting. We got to Canyonlands late in the day so we wanted to make sure that we made it to our campsite before sunset so we would not have to navigate rock piles at night. Doing it during the day is sometimes hard enough.

For the rest of the CURRENT day, we played at Arches National Park. And when I say played, I mean we sat on rocks, climbed on rocks, walked on rocks, looked at rocks, but they were all cool rocks. It was hot and we were pretty tired, so it was hard to enjoy. However, it was really cool to see the arches/windows and was super fun to climb some of them too.

Try and find me!

Try and find me!

Got my heart pounding today when I lost my Go-Pro! So many awesome pictures would’ve been lost, but thankfully I found it when a French gentleman overheard Clint and I talking about finding it, he pointed us to its location and it was still there!! Woo! That’ll make your day.


Thursday, July 3rd – Colorado Springs, Colorado

Went to Garden of the Gods yesterday and rock climbed! WP_20140702_16_01_36_ProI’ve been rock climbing before but never for real. We climbed a 100 foot rock to the top and I was scared to death but was so crazy fun! I now know that I will not be taking up rock climbing as a hobby. Clint and a friend named Joel did most of the “real” climbing. From there we went to where Katy was staying for the summer which apparently was just some navigator staff members house. It was so nice of that family to let a bunch of strangers crash at their house! Chad, and all the Koesters were there! We all went out for Mexican and had way too expensive margaritas, but it was fun. We got to tell all of our stories and people definitely respected us for the trip. I might need to get used to it for the next few weeks.DCIM100GOPRO


Saturday, July 5th – Back in corn country…

On our way home! Hard to believe its all over. Driving through corn fields are as boring as I remember. Last night was really fun without considering the fireworks. A day hike to a water fall in snow mountain, putt putt, followed by traveling to grand lake for the afternoon. WP_20140704_12_26_50_ProPeople of all nationalities were present. Just an absurd amount of people for such a small town, but I’m sure local businesses were loving it. It rained for maybe 30 minutes 2 hours before the fireworks show. It was kinda bad though thankfully our spot was being held by others. WP_20140704_20_21_25_ProClint, Sam and I managed to find some cross country backpackers named Stride and Smiles. What a crazy story they had. They started on the border of Mexico in late April and have been backpacking north ever since. Their goal is to reach Canada which I’m sure they will do by early August. Stride had hiked the Appalachian Trail, the PCT, and they were currently doing the CDT. Unbelievable! Wow would it be cool to do that if I had the money and time.

Clouds in Colorado...

Clouds in Colorado…

Last night we ended up staying at a friends house garage in Granby. It was actually super nice not having to set up tents or anything. Slept super deep and really feel used to “roughing it”. Time to go home I guess. Another quick point, I brought way too many clothes on this trip. Probably because I thought I would sweat buckets… On the contrary, it has been so dry out here that all moisture evaporates instantly.

Lastly today, we went to visit Clints Aunt and Uncles place. They bought us lunch and his uncle showed us the business that he worked for and was very passionate about. Super nice of them! Data View was a company that made plates for laser cutting of waffles (kinda like motherboards for phones… Not the food), to make them more flat. It was interesting!

Tuesday, July 8th – Owen Main Office

Nothing like being back in the humid Midwest! Typing on a computer makes my fingers feel like they are old rusty gears that can’t move smoothly. It’s definitely great to be back in home with a bed and air conditioning, but I definitely don’t recognize how awesome this trip was. I may never again be able to visit (AND HIKE) 5 national parks in the span of 2 weeks. I know I will go back to many of these places, but not like this time.

Things I won’t miss… Giant annoying crows (aka Frank) waking us up every morning, FAT squirrels eating my food, chipmunks climbing my back TRYING to eat my food, peanut butter, crunchy peanut butter, granola bars and peanut butter, granola bars and crunchy peanut butter, freaking Denver traffic, the crammed backseat of a Chevy Cobalt, unpacking and repacking of the backseat and trunk of said Chevy Cobalt and lastly… THE HEAT.

This was a trip of a life time, and I hope to keep finding adventures.


Find more pictures on my Facebook.


Update: Well shoot dang. So I can’t believe I did this, but I forgot that Arches is a National Park! So we actually hit 6 national parks on this trip!

Also here are some interesting facts from our trip:

  • 70 miles of hiking
  • 2.5 miles of elevation gain
  • about 4,300 miles of driving
  • Max temp: 109F (124F in the sun) | Min temp: 46F

Collaboration Technology

Setting up times and locations to meet, losing important documents, miscommunication can all be considered problems of group work before the time of online collaboration tools. Today we have the tools to collaborate on scales that have never been previously imaginable. This can bring creative minds from all around the world together to work on projects, research or even grocery lists. There are many tools online that allow us to accomplish this. To know which tool to use, it is important to know your project, how you plan on collaborating and how you want the finished product to look like. In this blog post, I plan to review 3 different online collaborative tools which will help you decide which tool you might want to use.

First off, I am going to talk about a tool called SpiderScribe.net. Upload any text, image or file you want onto the dashboard and then connect your content with an idea by drawing custom arrows to keep things organized. If you have a large project or a plethora of ideas, then SpiderScibe.net can help you bring everything your group has into one valuable product. This tool can be viewed on the computer, a tablet or a mobile phone, so one can be free to add to their project whenever they please. The only seeming drawback of SpiderScibe.net is the fact that it is not entirely free to use. Therefore, this tool is best suited for business or large group collaboration.

demo_pic1l

Secondly we have a tool that is called TitanPad. Get to the TitanPad front page and start writing within seconds of getting there. This website is very light, but extremely effective and simple. If you wanted a private subdomain for your team website, that is also possible through TitanPad. Moreover, this tool requires no sign up and is completely free to use. TitanPad is viewable on the PC, tablets and cell phones, which allows the editor to collaborate in a variety of settings. So this tool really can be utilized by a family who wants to collaborate on a grocery list or a research team that is looking for a committed collaborative text editing tool for their publication.

tiantitan2

Lastly, Google Docs is a tool that is by far the most popular and well-rounded tool on the internet. Create text documents, presentations and spreadsheets while having the ability to collaborate on all of them at any time. Google Docs packs a huge amount of potential productivity for the cheap price of free. Sign in with a Google account and you can invite anyone to work with you on a project large or small. Docs does not connect ideas as well as SpiderScibe.net, especially if you have a large project to work on. Therefore, I recommend using Google Docs if you are student working on a semester project, or just a human working on any medium size project. If you are still having trouble deciding on what tool to use, Google Docs is usually a good starting place as well.

Google Docs

These are just 3 tools in a bucket that is completely filled with them. There are many other tools available out there that continue to tailor to the needs of collaborative workers. I picked these three to review because they were the most general tools that I believed could be applied in many different environments of collaboration. Google Docs is the most popular that can be applied to almost any collaborative working environment and I personally will recommend it as my personal favorite (though I am a college student). TitanPad and SpiderScibe.net give you a little more of a tailored interface and therefore might be better in some circumstances. However, figuring out which tool works best for you comes from experimenting with multiple tools. So don’t be afraid to explore and try new things when working on your next collaborative project.

Social Analytics

When trying to do research in the realm of communication or sociology, it often helps to be able to visualize data connections and similarities. Gephi software allows you to visualize data that would otherwise be very hard to analyze without an image. This software essentially functions like Excel and Photoshop as it allows you to input a data set and then customize your graphic in many different ways. There are many other social graph producing programs out there, but Gephi definitely allows you to apply the most customization to your graphics. I do not have too much experience with this kind of software, but in the little time I have played around with Giphi, it is clear that there is a lot that can be done with this program. Although there is a bit of a learning curve to it, it really produces some unbelievable products.

Image

My social network as seen above has many separate groups but still is relatively uniform. The colors represent my communities of friends over the years on Facebook. The green color represents my college community while the red and blue represent my high school years. The yellow and light blue are comprised mainly of two different summers while in college. The groupings of nodes are positioned by the amount of time I have been friends with that person on Facebook. In my network, I see 2 main groupings of clusters that seem to be subdivided into 2 separate groups from there.

The most interesting conclusion I reached during this analysis was that I have met many people over each of my summers here college. This I knew of course, but to actually visualize gives it a whole other meaning. In addition, I am able to find my high school classmates that came to Purdue by finding the nodes that have many connections between the green and blues/reds. A bit of a simple conclusion would be that I have met more people in college than ever before according to my social graph.

Playing around with this software is exceptionally enjoyable. You see these kinds of graphs on Buzzfeeds, Twitter and Facebook all the time and to actually learn how to make them is pretty cool. It is also clear that these graphs can be seriously used to diagnose research in many different professions. Obviously being most applicable to social networking and societal research, I think this software can also be used heavily in statistical research. With this software, you can take your entire population and see its distribution. Let’s say you were looking at a population of people’s favorite vegetable. Gephi can do an excellent job in dividing up the data to show visually what people may prefer. Though that is a simple example, there are many applications of decision based statistical analyses that you could do with this program. I would recommend this program to anyone simply looking to visualize data. 

RSS – Read. Search. Summarize.

For a long time, I can remember seeing RSS links in various websites that I would visit. The RSS symbol looked like the exact symbol as the Wi-Fi symbol on my phone so I thought they had to be related. To be honest, I must say that I never fully understood their purpose. However, understanding how a RSS reader can help you stay informed can change the way you receive your news (it is certainly changing mine). For me and many others in my generation, I receive most of my news via the internet rather than TV, newspaper or radio. Using an RSS reader to visualize all of your gathered RSS feeds can make a difference on how you find news, read news and react to it. You can pull links from almost any website you gather news from and view it all under one location. This puts a big responsibility on RSS reader developers to make a good product that is both user-friendly and immersive. In the following paragraphs, I will take a look at 3 different RSS readers available for free to give you a better idea as to which one you might want to use.

There are many different RSS readers available for us to use for free on the internet. One popular reader we looked at in class was called Feedly, which offers you are very minimalistic webpage with average customizability.

com435feedly

Adding and organizing content is very simple with the links to do these actions in the upper left corner of your homepage (note image to the left). One downside to this site is the numbers you see listed next to my various feeds are unread articles in that feed. These numbers will only go away if you mark all articles in the feed as “read”. This process is accomplished better through other sites in my opinion. However, this is a solid RSS reader overall!

Another reader that you would have the option of picking is called NewsBlur. This reader presents its information in a bit of an aggressive fashion, but it is very interactive and makes you want to click on links.

com435NewsBlur

One of my favorite features about NewsBlur is when you view an unread article (even if only for seconds), it will mark it as read and will not continue to show in your unread article count next to the category. This reader really will encourage you to sort your feeds to get the most out of your left side bar. In that sense, the left side bar has a bit of an apple look and feel to the navigation. If you are a Mac user and looking for a Mac OS-like RSS reader, than this might be a good choice!

The last reader I will touch on will be Digg! Digg is my reader of choice and I will explain to you why I enjoy it. Digg presents itself in a minimalistic fashion in comparison to NewsBlur, but still has similar features. The left side navigation bar is more compressed and visually appealing than NewsBlur, but still offer you the same amount of view ability. Also, Digg has my favorite article preview of all these 3 readers which you can see below. You can see just enough of the article to decide if you want to go to the website to invest in it or not.

com435digg

In Feedly, you end up getting two previews of the article before you can get to the website to read the article and NewsBlur is just too aggressive for my taste. Therefore, I vote for Digg as the best RSS reader out of these 3 listed.

One thing is for sure when you are searching for your RSS reader of choice and that is that there are plenty to chose from! Therefore, play around with each one and figure out what you like about each site. Doing this will help you find the right RSS reader and than your best way to Read, Search and Summarize your news.

So Many Blogs to Chose From

I do not consider myself a blogger. More over, I do not consider myself a writer. I have always associated myself with the scientific community, in which, I thought nobody blogged. Truth be told, a TON of scientists blog about their findings, ideas and hypotheses. Many scientists I see use Tumblr or WordPress, but what is the difference between these two blog platforms? Overall, these two platforms accomplish the same thing. They are both meant to capture your creativity, your stories, pictures, videos and other media. However, WordPress presents this information in a more formal format. WordPress also has a customizability option which can make it more like your own website in addition to your blog. Tumblr is Twitter in an extended format and is based heavily on connecting with your friends and community. Updates that I catch from Dr. Neil Degrasse Tyson(Astro-physicist) on Tumblr are very personable and informal. Updates I see on WordPress are generally abstract in nature as it is generally scientists trying to get their ideas down on paper (or the computer).

Basically, go to Tumblr if you are looking for more of an extended social network, or go to WordPress for customizability and formality.